I’ve been regularly reviewing Labour’s performance in local council by-elections for LabourList.
What’s happened on this front in the three months since the start of the year?
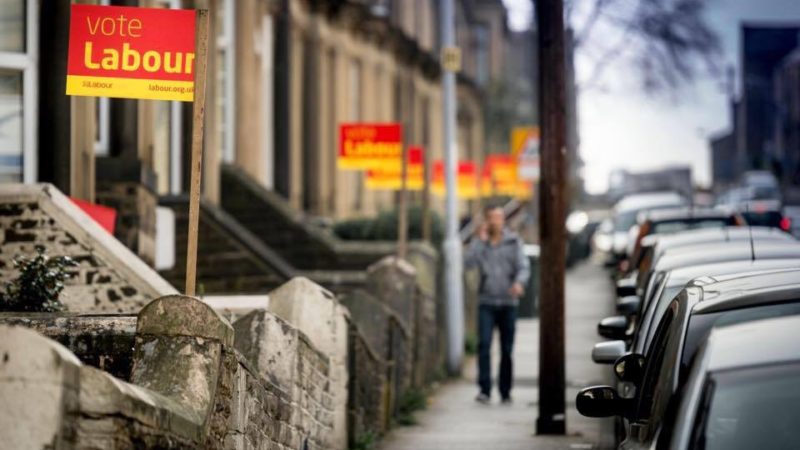
Here, in the same format as I presented them previously, is the change in Labour vote share in all the council by-elections where there has been a Labour candidate in the last two contests (so a comparison can be drawn) since the start of 2017. The results are grouped by region so you can see the pattern around the country.
As in my previous reviews there are stark regional variations, with the caveat that some regions saw very few by-elections during this period.
There were no by-elections in Wales during this period and only one in Scotland – showing the now usual pattern of a steep fall in Labour’s vote – as they have all-out local elections scheduled in May.
In line with the previous pattern London saw Labour’s vote going up in its single by-election. The worst performing regions were the North and North West.
Of a total of 32 by-elections during this period Labour’s vote share was down in 24 of the contests, three quarters, which is noticeably worse than the pattern last year, when it was more like two-thirds.
Eastern (average Labour vote share down 5.4 per cent)
Elsenham & Henham (Uttlesford) -2.3 per cent
Gade Valley (Three Rivers) -9.6 per cent
Great & Little Oakley (Tendring) +5.5 per cent
Hertford Castle (East Hertfordshire) -2.9 per cent
Waltham Cross (Broxbourne) -14.8 per cent
Waterside (North Norfolk) -8.5 per cent
East Midlands (average Labour vote share up 4 per cent)
Derwent (Derbyshire) -2.4 per cent
Kingswood & Hazel Leys (Corby) +10.3 per cent
London
Roxbourne (Harrow) +13.7 per cent
North (average Labour vote share down 16.0 per cent)
Hutton (Redcar & Cleveland) -16.6 per cent
Newcomen (Redcar & Cleveland) -5.8 per cent
Sandhill (Sunderland) -29.9 per cent
South Heaton (Newcastle-upon-Tyne) -11.8 per cent
North West (average Labour vote share down 8.5 per cent)
Bollington (East Cheshire) -8.6 per cent
Failsworth East (Oldham) -7.3 per cent
Higher Croft (Blackburn) -10.4 per cent
Kersal (Salford) -21.5 per cent
St Johns (Fylde) -8.4 per cent
Walton le Dale East (South Ribble) -9.4 per cent
Warbreck (Blackpool) +6.3 per cent
Scotland
Kilmarnock East & Hurlford (East Ayrshire) -16.6 per cent
South East (average Labour vote share up 6.8 per cent)
Emmbrook (Wokingham) -6.1 per cent
Hailey, Minster Lovell & Leafield (West Oxfordshire) -4.5 per cent
Winklebury (Basingstoke & Deane) +31.1 per cent
South West (average Labour vote share down 5.8 per cent)
Lydbrook & Ruardean (Forest of Dean) -2.0 per cent
Mudeford & Friars Cliff (Christchurch) -9.6 per cent
West Midlands (average Labour vote share up 0.6 per cent)
Burton (East Staffordshire) -5.2 per cent
Norton (Bromsgrove) +7.1 per cent
St Thomas’s (Dudley) +3.4 per cent
Town (East Staffordshire) -3.0 per cent
Yorkshire & Humberside (average Labour vote share down 5.4 per cent)
Brinsworth & Catcliffe (Rotherham) -26.2 per cent
Dinnington (Rotherham) +15.5 per cent

More from LabourList
Exclusive: Poll shows Starmer more trusted than PM on Middle East crisis
Revealed: Poll shows 1 in 4 Tory voters says Rayner faces ‘smear campaign’
‘Ignore the noise – the soft left is alive and well in Open Labour and beyond’