The publication of British Election Study data on the 2019 general election last week went relatively unnoticed amid concerns about Covid-19. For those of you unfamiliar with the BES, this is the ‘gold standard’ when it comes to analyses of general elections, as well as other elections. It tracks not just the voting intentions of large numbers of people – between 35,000 and 38,000 – but also people’s changing voting patterns over time.
In the run up to last year’s general election, the BES undertook several waves of an internet panel survey. The pre-election wave was on November 1st and 12th and involved just under 35,000 people. The campaign wave was on November 13th and December 11th, and polled just under 38,000 people. Finally, there was a post-election follow-up wave on December 13th and 23rd, involving just over 32,000 people, a 70% retention rate of the campaign wave cohort.
The initial analysis of these data is striking. After months of speculation, it provides the actual evidence of why people voted as they did. One of the most important, if sobering, points was that the election saw the confirmation of the end to party political allegiances as we have known them. Vote switching between Conservatives to Labour, Labour to Conservative, between Labour and Liberal Democrats and so on, was very marked. 12% of Labour’s vote from the GE in 2017 went to the Tory Party with only 4% of Tory votes coming to Labour.
There was noticeable campaign ‘volatility’ of Labour voters, with over 30% switching to another party or saying they didn’t know how they were going to vote during the campaign compared with a much lower rate of Tory voters. Interestingly, when analysing inter-election volatility – that is, how much switching there was between parties from one election to the next – the BES showed this was most pronounced in 2015. GE19 showed the lowest level of switching from the previous election since the GE in 2001. It appears that large numbers (1.3 million) of 2017 UKIP ‘abstainers’ gave their support to the Tories in 2019.
What else changed between 2017 and 2019? In relation to where people placed themselves on a scale of left to right values, which broadly relates to attitudes to economic policy – for example, redistribution and big business – and how this reflected their voting intention, most people placed themselves as centrists. A fairly even distribution favoured left of centre and right of centre economic policies. Unsurprisingly, Labour voters were more left-leaning, but there was some mismatch with where voters as a whole perceived themselves on a left-right scale and how they perceived the Labour Party’s position on this scale. Over 30% of non-Labour voters saw Labour’s policies as the most left that they could be – i.e. zero on a zero to ten left to right scale.
When both economic/left-right values and social-liberalism values – such as attitudes to law and order, censorship, and so on – are considered together, it is clear that Labour voters have become significantly more liberal and progressive in 2019 compared with 2015. Conservative voters have more authoritarian values, more closely aligned with people who had supported the Brexit Party and their forerunners, UKIP. Social class is no longer a predictor of voting intention. But the change in left-right values in 2019 compared with 2017 was marginal. We didn’t lose because we became more ‘left wing’.
This alignment of values also broadly corresponded with whether someone identified themselves as a Leave or Remain supporter in the EU referendum. In the run up to GE19, nearly eight out of ten Remain supporters identified themselves as Labour voters, and this was broadly reflected in strong Leave (over 60%) and narrow Leave (50-60%) seats, including the so-called ‘Red Wall’ constituencies. But when it came to December 12th, many previously identified Labour voters failed to support us. Again, why? The evidence indicates that it was not our Brexit position.
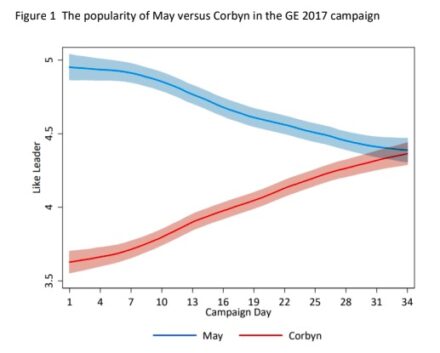
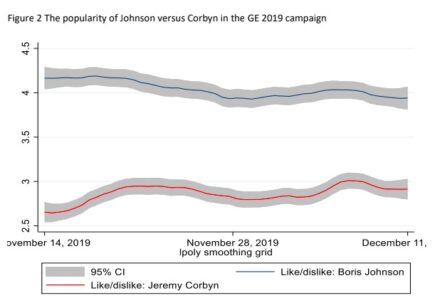
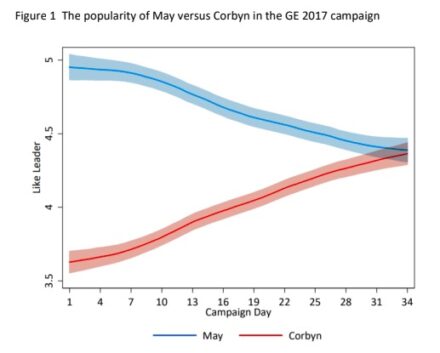
From the GE19 BES data, it is clear that one of the key drivers for the way people voted was whether they preferred one leader to another. In 2017, over the course of the campaign, the decline in popularity of Theresa May was matched with an increase in popularity in Jeremy Corbyn (fig. 1). In 2019, however, the same preference for Jeremy Corbyn as opposed to Boris Johnson just didn’t materialise (fig. 2). What isn’t clear is what drove these views on the different leaders.


The other key driver was voters’ ‘feelings towards Labour’ (fig. 3). To put it bluntly, we just weren’t trusted. Again, it is unclear what led to this mistrust. Although I’m sure there will be much speculation and personal views about the ‘drivers of the drivers’, I would counsel caution.

Always an optimist, I believe that this is fixable. The election of a new party leader provides the opportunity for new beginnings, to learn from our mistakes. We need to have a better understanding of the ‘drivers of the drivers’, but we also need to address those issues we already know about. We need to be competent and relevant to people’s day to day lives. We need to tackle the inequalities in income and wealth but also in power. We know the more unequal a society, the less trust there is between different communities, and crime rates are higher. Our mental health even how long we live are directly impacted by these inequalities.
Less is known about inequalities in power and their impacts. This includes inequalities in political power, where politicians have power over rather than with citizens, and practical, everyday power – for example, how responsive and supportive local services are, or not, whether that’s housing, health or other services. We need to do more here. For me, how we treat people, how we work, needs to be as much as a priority as our policy platform. And it needs to start now.


More from LabourList
Letters to the Editor – week ending 15th February 2026
‘Labour council candidates – it’s tough, but all is not lost’
‘Labour won’t stop the far right by changing leaders — only by proving what the left can deliver’