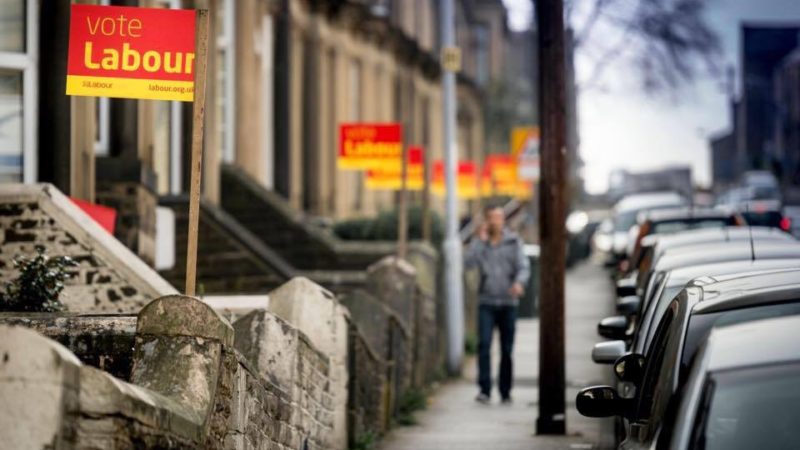
I’ve been reviewing Labour’s performance in local council by-elections on a regular basis for LabourList. To round off the year, I’ll look at what has happened on this front in the period since the main set of council elections at the start of May.
Here, in the same format as I have presented them previously, is the change in Labour vote share in all the council by-elections where there has been a Labour candidate in the last two contests (to allow a comparison to be drawn). The results are grouped by region so you can see the pattern around the country.
As usual, there is wide regional variation. The best performing region is the North with an average change in the Labour vote of +10.1%. This is followed by the West Midlands (+6.8) and East Midlands (+6.1). Then come the South West (+3.1) and Scotland (+2.4).
There is a whole group of regions where the average change in the Labour vote has been statistically insignificant: Eastern (+0.5); London (+0.2); North West (-0.8); South East (-1.1); Yorkshire and Humber (+0.7). For Labour to be making no headway at all in council by-elections in five regions just isn’t good enough in the mid-term of a failing Tory government.
By far the worst results are in Wales (-12.9), though this is on a very small sample of four results. In most regions, the numbers are noticeably worse than in the January to April period (which you can see reviewed here).
Of a total of 114 by-elections during this period, Labour’s vote share was up in 56 of the contests, 49%. That is significantly worse than at any previous point since the general election, but still better than the pattern before June 2017.
Eastern – average change in Labour vote +0.5%
Bosmere (Suffolk) +2.4%
Bush Fair (Harlow) +5.6%
Lee Chapel North (Basildon) +20%
Leiston (Suffolk Coastal) +3.9%
Limbury (Luton) -11.6%
Nettleswell (Harlow) +2.5%
Orton Longueville (Peterborough) +12.4%
Oxhey (Watford) -1.2%
Pakefield (Waveney) -5.2%
Petersfield (Cambridge) -10.6%
Pitsea South East (Basildon) +11.2%
Soham North & Isleham (Cambridgeshire) -5.5%
Southwold & Reydon (Waveney) -14.7%
Three Rivers Rural (Hertfordshire) -0.1%
Toddbrook (Harlow) +5.4%
Watton-at-Stone (East Hertfordshire) -8.3%
Welwyn West (Welwyn Hatfield) -7.5%
Yare & All Saints (Norfolk) +10.1%
East Midlands – average change in Labour vote +6.1%
Anstey (Charnwood) +33.6%
Astwell (South Northamptonshire) +0.9%
Belgrave (Leicester) +17%
Birstall Wanlip (Charnwood) +7%
Clifton North (Nottingham) -4.2%
Delapre & Briar Hill (Northampton) +15.6%
East Retford West (Bassetlaw) +12.7%
Gotham (Rushcliffe) +7.4%
Linton (South Derbyshire) +2.8%
Moor (Chesterfield) -9.9%
Quorn & Mountsorrel Castle (Charnwood) -5.1%
St George (Northamptonshire) +4.3%
Syston Ridgeway (Leicestershire) -2.3%
London – average change in Labour vote +0.2%
Belmont (Sutton) -6.1%
Boleyn (Newham) +4.3%
Bush Hill Park (Enfield) -9%
Coldharbour (Lambeth) +2.3%
Dormers Wells (Ealing) +2.9%
Kelsey & Eden Park (Bromley) +1.7%
Lancaster Gate (Westminster) -0.5%
Victoria (Hackney) -9.7%
West Green (Haringey) -8.4%
Willesden Green (Brent) +24.2%
North – average change in Labour vote +10.1%
Brambles & Thorntree (Middlesbrough) +22.4%
Cockerton (Darlington) +7.9%
Denton Holme (Carlisle) +11.2%
Hart (Hartlepool) +9.2%
Rural West (Hartlepool) -0.3%
North West – average change in Labour vote -0.8%
Ansdell (Fylde) +5.1%
Arnside & Milnthorpe (South Lakeland) -1.7%
Ashton Waterloo (Tameside) -7.1%
Besses (Bury) -7.6%
Bromborough (Wirral) -3.4%
Ditton (Halton) -4.7%
East (Bury) +4.3%
Eccles (Salford) -7.1%
Edgeley & Cheadle Heath (Stockport) +16.2%
Failsworth East (Oldham) -7.2%
Halewood South (Knowsley) -0.8%
Hesketh with Becconsall (West Lancashire) +4%
Kent Estuary (Cumbria) -0.7%
Knowsley (West Lancashire) -9.6%
Penketh & Cuerdley (Warrington) -19%
Skerton (Lancaster) +20.8%
Tanhouse (West Lancashire) -12.8%
University & Scotforth Rural (Lancaster) +12.3%
Upton (Wirral) +3.2%
Scotland – average change in Labour vote +2.4%
Coatbridge South (North Lanarkshire) +12.6%
Inverkeithing & Dalgety Bay (Fife) -4.8%
Wester Ross, Strathpeffer & Lochalsh (Highland) -0.7%
South East – average change in Labour vote -1.1%
Aylesbury North West (Buckinghamshire) +2.9%
Benson & Crowmarsh (South Oxfordshire) -4%
Bicester West (Cherwell) +8.3%
Birchington South (Thanet) +14.9%
Bletchley East (Milton Keynes) +3.1%
Canterbury North (Kent) +4.1%
Datchet (Windsor & Maidenhead) -8.5%
Farnham Castle (Waverley) -10%
Farningham, Horton Kirby & South Darenth (Sevenoaks) -5.6%
Grove & Wantage (Oxfordshire) -2%
Headcorn (Maidstone) -2.2%
Headington (Oxford) +3.2%
Iffley Fields & St Mary’s (Oxfordshire) +1.7%
Kempshott (Basingstoke & Deane) +13.4%
Kennington (Ashford) -3.5%
Nonsuch (Epsom & Ewell) -3.4%
Norden (Basingstoke & Deane) +5.5%
Pennington (New Forest) -10.9%
Southlands (Adur) +16.9%
Upper Meon Valley (Winchester) -7.6%
Wheatley (Oxfordshire) -4%
Wolvercote (Oxford) -0.1%
South West – average change in Labour vote +3.1%
Alcombe (West Somerset) -5.4%
Bude (Cornwall) -1.6%
Canmore (Mid Devon) +7%
Dodington (South Gloucestershire) -1.6%
Dursley (Stroud) +13.5%
Kingsmead (Bath & North East Somerset) +11.6%
Stoke (Plymouth) +16.7%
Wells St Thomas (Mendip) -9.8%
Westbury-on-Trym & Henleaze (Bristol) -2.6%
Wales – average change in Labour vote -12.9%
Gurnos (Merthyr Tydfil) +18%
Gwynfi (Neath Port Talbot) -43.1%
Saron (Carmarthenshire) -15%
St Mary North (Pembrokeshire) -11.6%
West Midlands – average change in Labour vote +6.8%
Bewdley & Rock (Wyre Forest) +9.3%
Crown (East Staffordshire) -8.5%
Curborough (Lichfield) +27.2%
Glascote (Tamworth) -14%
Newton Regis & Warton (North Warwickshire) +21.5%
Stowe (Lichfield) +12.7%
Stratford North (Warwickshire) -0.9%
Yorkshire & Humber – average change in Labour vote +0.7%
Denby Dale (Kirklees) +3.8%
Freshney (North East Lincolnshire) -0.5%
Knaresborough (North Yorkshire) -1.4%
Old Town (Barnsley) -5.9%
Town (Doncaster) +7.7%


More from LabourList
‘Council Tax shouldn’t punish those who have the least or those we owe the most’
Two-thirds of Labour members say government has made too many policy U-turns, poll reveals
‘Two states, one future: five steps on the path to peace for Israelis and Palestinians’