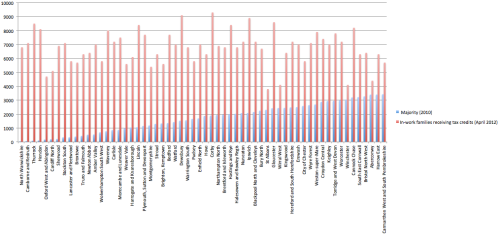
Several of this morning’s papers (including The Times – dropping the story in a Tory paper perchance?) have run with Labour research which indicates that the number of in work families receiving tax credits (and therefore being hit by what Labour are calling his “strivers tax” as tax credits face a real terms cut) significantly exceeds the size of the Tory majority in 60 of the most marginal Tory seats.
A Labour source told us this morning:
“George Osborne thinks he is playing a clever political game, but he could have cost the seats of dozens of his conservative colleagues. Everybody knows the next election will be a living standards election, George Osborne’s strivers tax is going to his thousands of working families in Tory marginals across the country.”
This certainly looks like Labour are planning on mounting a robust defence against Osborne’s welfare cuts bill.
We’ve crunched the numbers, and this bar chart below shows the scale of Osborne’s attack on in-work families in comparison with the relative electoral weakness of the Tories in the same seats (Click on the image to enlarge):
And if you want to see the specific numbers from any of the seats, we’ve published the table below:
| Conservative-held marginal constituencies, and in-work families receiving tax credits | ||
| Constituency |
Majority (2010) |
In-work families receiving tax credits (April 2012) |
| North Warwickshire |
54 |
6,800 |
| Camborne and Redruth |
66 |
7,100 |
| Thurrock |
92 |
8,500 |
| Hendon |
106 |
8,100 |
| Oxford West and Abingdon |
176 |
4,700 |
| Cardiff North |
194 |
5,100 |
| Sherwood |
214 |
6,900 |
| Stockton South |
332 |
7,100 |
| Lancaster and Fleetwood |
333 |
5,800 |
| Broxtowe |
389 |
5,700 |
| Truro and Falmouth |
435 |
6,300 |
| Newton Abbot |
523 |
6,400 |
| Amber Valley |
536 |
7,000 |
| Wolverhampton South West |
691 |
5,800 |
| Waveney |
769 |
8,000 |
| Carlisle |
853 |
7,200 |
| Morecambe and Lunesdale |
866 |
7,500 |
| Weaver Vale |
991 |
5,600 |
| Harrogate and Knaresborough |
1,039 |
6,100 |
| Lincoln |
1,058 |
8,400 |
| Plymouth, Sutton and Devonport |
1,149 |
7,700 |
| Montgomeryshire |
1,184 |
5,400 |
| Stroud |
1,299 |
6,300 |
| Brighton, Kemptown |
1,328 |
5,600 |
| Bedford |
1,353 |
7,700 |
| Watford |
1,425 |
7,000 |
| Dewsbury |
1,526 |
9,100 |
| Warrington South |
1,553 |
6,800 |
| Pudsey |
1,659 |
5,800 |
| Enfield North |
1,692 |
7,000 |
| Hove |
1,868 |
6,300 |
| Corby |
1,895 |
9,300 |
| Northampton North |
1,936 |
6,900 |
| Brentford and Isleworth |
1,958 |
6,800 |
| Hastings and Rye |
1,993 |
8,400 |
| Halesowen and Rowley Regis |
2,023 |
6,800 |
| Nuneaton |
2,069 |
7,200 |
| Ipswich |
2,079 |
8,900 |
| Blackpool North and Cleveleys |
2,150 |
7,200 |
| Bury North |
2,243 |
6,700 |
| St Albans |
2,305 |
3,800 |
| Gloucester |
2,420 |
8,600 |
| Wirral West |
2,436 |
4,100 |
| Kingswood |
2,445 |
6,400 |
| Hereford and South Herefordshire |
2,481 |
7,200 |
| Erewash |
2,501 |
7,000 |
| City of Chester |
2,583 |
5,800 |
| Wyre Forest |
2,643 |
7,100 |
| Weston-super-Mare |
2,691 |
7,900 |
| Croydon Central |
2,879 |
7,400 |
| Keighley |
2,940 |
7,000 |
| Torridge and West Devon |
2,957 |
7,800 |
| Worcester |
2,982 |
7,200 |
| Winchester |
3,048 |
4,100 |
| Cannock Chase |
3,195 |
8,200 |
| South East Cornwall |
3,220 |
6,300 |
| Bristol North West |
3,274 |
6,400 |
| Aberconwy |
3,398 |
4,400 |
| Harrow East |
3,403 |
6,300 |
| Carmarthen West and South Pembrokeshire |
3,423 |
5,700 |
| Notes: Tax Credit recipient families are rounded to nearest 100 | ||
| Election data refers to 2010 General election, ignoring any subsequent by-elections | ||
| Sources: Electoral Comission, HMRC | ||


More from LabourList
‘Court reform: The myths are loud, but the facts are clear’
‘Only Labour is delivering for leaseholders facing a cost-of-living crisis’
‘Beyond the sticking plaster: why LVT is the key to Labour’s promise of high street renewal’