

Over the summer our Independent Inquiry published 5 key messages about Labour’s defeat in May. This sixth comes courtesy of Survation who have kindly leant us their data and their expertise. It reveals the myth of Labour’s 35 per cent strategy and the idea that Labour can win elections without building a broad electoral alliance.
Labour’s advantage over the Conservatives among 2010 Liberal Democrat voters had collapsed by half from early 2012 to May 2015, as these voters drifted to the Greens, SNP, UKIP and the Conservatives. And while the Conservatives won back half the voters it had at one stage lost to UKIP, Labour won back very few.
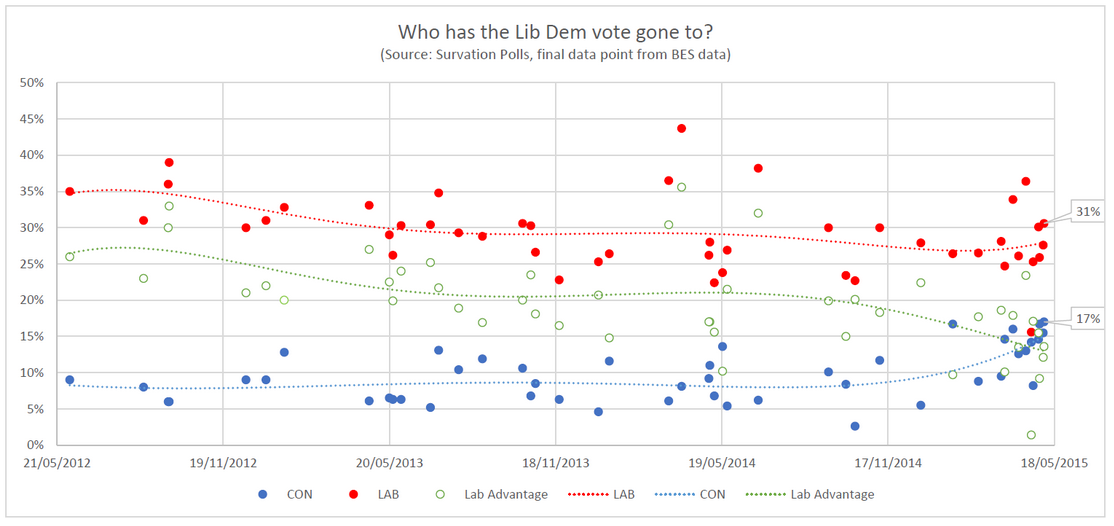
Survation looked at the percentage of 2010 Liberal Democrat voters each party was picking up and the percentage of their 2010 voters that had gone to UKIP. By compiling their data since 2012 Survation tracked these changes over time.
The graph below shows that Labour’s lead among 2010 Liberal Democrat voters was around 25 points in early 2012. By the time of the 2015 election it had nearly halved to around 13-14 points. The final data point is how people voted in the actual election according to Survation’s analysis of the British Election Study data of 30,000 respondents. (Click to enlarge)
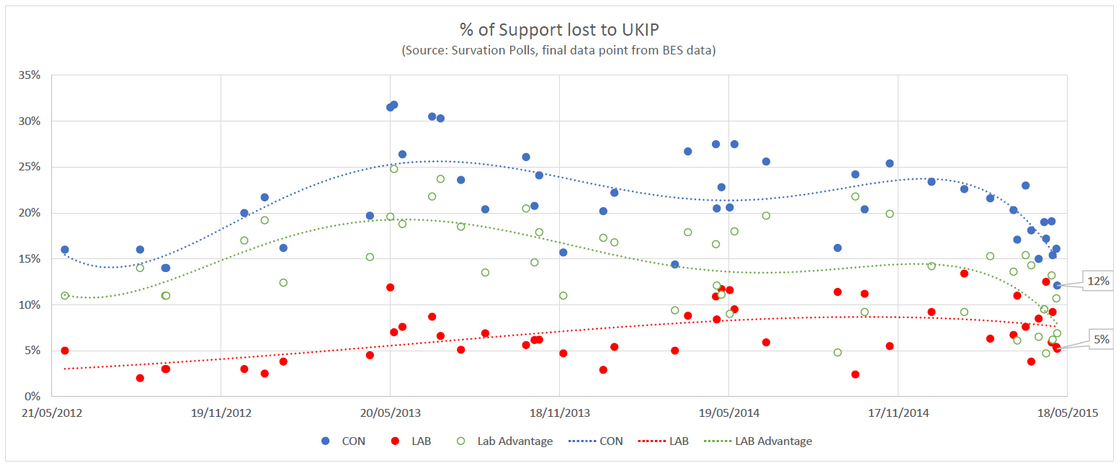
The second chart below shows the percentage of Labour and Conservative 2010 voters who were planning to vote UKIP. In spring 2013, the Conservatives were losing 25% of their 2010 voters to UKIP, compared with only 5% of Labour voters – a relative advantage to Labour of 20 points.
However whilst Labour lost more and more voters to UKIP at a slow but steady pace throughout the parliament, the Conservatives losses peaked in 2013. They then recovered some voters, before rapidly recovering a large proportion of them during their aggressive period of campaigning between January and May 2015.
In the end, according to Survation’s analysis of the British Election Study data, the Conservatives only lost 12% of their 2010 voters to UKIP compared to 5% for Labour – a relative advantage to Labour of only 7 points, down considerably from the peak of 20. (Click to enlarge)
Given regional variations, it is almost certain that there are constituencies where these two trends were actually reversed completely. There will be constituencies where Labour lost more voters to UKIP than the Conservatives did, and there will be constituencies where the Conservatives picked up more of the Liberal Democrat vote than Labour did.
There were 89 constituencies in England and Wales where both the Conservative vote share went up AND the Labour vote share went down, despite the Liberal Democrats losing an average of 13 points and UKIP gaining an average of 12 points across all these seats.
Either the direct Labour to Conservative swing in those places was large enough to more than cancel out whatever small benefit Labour was still getting from the breakdown of Liberal Democrat and UKIP switchers. Or it means that in many of these constituencies the net effect of the collapse in Liberal Democrat vote and the surge in the UKIP vote was actually of benefit to the Conservatives.
There are some striking examples of this, particularly in those small pockets of the South outside of London where Labour was still competitive. In Plymouth Moor View Labour lost the seat to the Conservatives on a 3 point swing, despite the Liberal Democrat vote share collapsing from 17% to 3% and the UKIP share rising from 8% to 22%.
Southampton Itchen shows a similar picture, with a Conservative gain from Labour on a 3 point net swing, despite a Liberal Democrat drop of 17 points and a UKIP rise of 9 points. In both these constituencies the Liberal Democrat collapse and the UKIP surge were seemingly doing nothing to help Labour. They may actually have worked against the party.
Even in seats where Labour were already starting from a low base and there were large numbers of Liberal Democrat votes up for grabs, the Labour Party managed to lose rather than gain votes. In Christchurch for example the party won 9.8% of the vote in 2010. In 2015 it won only 9.5% of the vote despite a 19 point drop in the Lib Dem vote and a 13 point increase in the UKIP vote.
In Wells and in Montgomeryshire, both constituencies which saw many Liberal Democrat votes in 2010 that the Labour Party would presumably have been hoping to gain a lot from, the Labour vote share actually went down significantly. In Wells in 2010 Labour won 4,198 votes. In 2015 it won just 3,780, despite the Liberal Democrats losing 5,898 votes. In Montgomeryshire Labour won 2,404 votes in 2010 and a mere 1,900 votes in 2015, despite Liberal Democrat losses of 2,913 votes.
Clearly in these places Labour was gaining nothing from the collapse in the Liberal Democrat vote – instead the main recipients of these 2010 Liberal Democrat voters were the Greens, UKIP and Conservatives, all of whom increased their vote share in these places by a significant amount.
What about the impact of UKIP taking Labour votes, particularly on Labour marginals? With the data we have the best we can say is that if 100% of 2015 UKIP voters voted for Labour instead (clearly not a realistic outcome), Labour would win 63 more seats from the Conservatives. If we look at a reasonable figure of 18-20% of UKIP support being former Labour voters, and posit that Labour had won back all those voters (still a hard ask in practice but more closely quantifying the UKIP-taking-Labour-votes effect), then Labour would have won/held an extra 13 seats from the Conservatives. These 13 are:
Bolton West
Brighton Kemptown
Bury North
Croydon Central
Derby North
Morley and Outwood
Plymouth Moor View
Plymouth Sutton and Devonport
Telford
Thurrock
Weaver Vale
Gower
Vale of Clwyd
There might well be a number of other constituencies in which the proportion of UKIP support coming from Labour was higher than 20%, so adding further seats to the list. To quantify this and to identify where these seats might be will mean analysing the relevant Ward samplings that were reliably taken at the count. This will be one of our next tasks.
My thanks to Patrick Briône, Director of Research at Survation for his analysis and help.
Jon Cruddas is MP for Dagenham and Rainham

More from LabourList
‘Debate and disagreement and are nothing to be feared’
Who can rebuild Scottish Labour?
‘Five things the Labour Chancellor should do to deliver good growth in every postcode’