Share this article:
The Lib Dems have hit the campaign trail in the Oldham West by-election with a classic example of their most fabled vote-winning technique: the leaflet bar chart.
The party has a long history of dodgy bar charts – and the latest is one of their best ever.
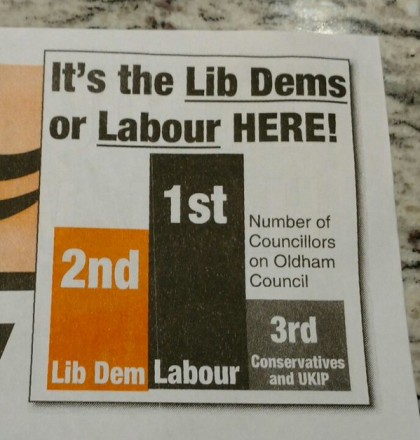
Posted on Twitter by Mike Smithson, the not-so-scientific chart shows the Lib Dems second to Labour on, er, number of councillors in Oldham. Labour has 45 councillors in the town, while, the Lib Dems are indeed second, with 10.
But in May’s General Election, the party finished fourth in Oldham West and Royton, with just 3.7% of the vote – 6,598 votes behind the third placed Tories, over 7,000 behind second placed UKIP, and a whopping 22,000 behind Labour’s Michael Meacher.
Winning here?

More from LabourList
‘Key provisions in Employment Rights Act and scrapping of two-child benefit cap come into force today’
Labour warns of Reform threat as it battles to hold Worthing council
‘Give us more time to do more’: Hackney Labour’s campaign to retain control of local council