
Every May since 2011 I have written a guide to what might constitute success for Labour in the local elections, then reviewed our performance after the results.
You can read my preview from March 18 – but the context has rather changed as a general election has been called!
Here’s how we performed on the various different measures:
- I said “For the English county and unitary council elections the key question is whether Labour can hold control of the two East Midlands counties which were our only gains in 2013, Derbyshire and Nottinghamshire.” Sadly we were unable to win either of these two councils.
- I said “Another key indicator will be whether Labour ends up with more county councillors than the Lib Dems, or slips into third place” – this excludes unitary councils. Labour now has just 260 councillors on the two-tier county authorities, but remains in second place ahead of the Lib Dems who have 224, so this target was achieved despite heavy losses.
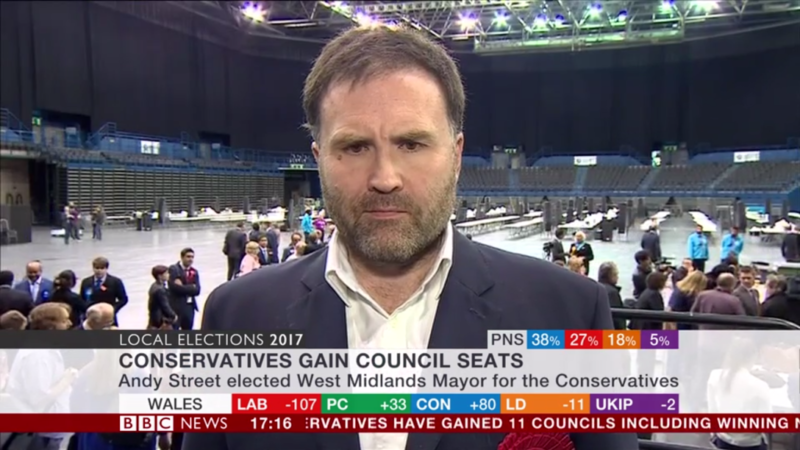
- On the six new metro mayors, we scored the expected wins in Greater Manchester and Liverpool city region, with both of them being comfortable, and Andy Burnham’s landslide in Manchester being a superb result by any measure. However, we didn’t take any of the more marginal three mayoralities – west Midlands, Teeside and west of England. In none of them did the transfer patterns from Lib Dems and Greens under supplementary voting help Labour. We were able to win the police commissioner election on the same boundaries in the west Midlands last year by 130,000 votes.
- We held the two borough mayors contested: Doncaster and North Tyneside, both of which have been lost in the past.
- In Scotland we lost control of all the councils we had had majority control in, including the iconic Glasgow. We fell to third place behind the Tories on number of councillors. I haven’t seen figures yet to show if this was the same on vote share.
- In Wales we had a mixed night, losing control of three of the eight councils we had gained in 2012 but holding the other five, including the key target of Cardiff where the Lib Dems had historically been strong.
- On the BBC’s projected national vote share figure, Labour got 27 per cent, two percentage points down on our performance in 2013, the equivalent year in the cycle and itself a weak year, and down six per cent compared to last year. However, Labour scored below this level in five years in the last decade when we were in government, including falling to 22 per cent in 2009. We are 10 per cent below the scores Ed Miliband got in 2011 and 2012, which were not enough to win the subsequent general election.
- Labour’s raw number of councillors is now by my calculation 6,297 (most councillors were not up for re-election on Thursday). This is our lowest figure since 2011, so all the progress made between 2011 and 2014 has now been reversed in 2015, 2016 and 2017. It is about 550 down on the equivalent year in the last parliament, 2013, and nearly 900 down on our recent peak of 7,180 in 2014. Our number of councillors has varied from a low of 4,436 in 2009 to over 10,000 in the late 1990s.
- We lost a net total of 382 councillors. This scale of losses is sadly unprecedented for an opposition party – usually the party not in national government gains local council seats.
- Our loss of control of seven councils takes us down to control of 107, the lowest figure since 2011.
- If we are looking for points of light in defensive parliamentary marginals, the performances in Exeter and Gedling stand out. Rawlings and Thrasher, the main academic experts on local election results, project Labour holding 215 MPs in the general election based on these local results, which is significantly more optimistic than projections based on the national opinion polls.


More from LabourList
‘Labour won’t stop the far right by changing leaders — only by proving what the left can deliver’
‘Cutting Welsh university funding would be economic vandalism, not reform’
Sadiq Khan signals he will stand for a fourth term as London Mayor