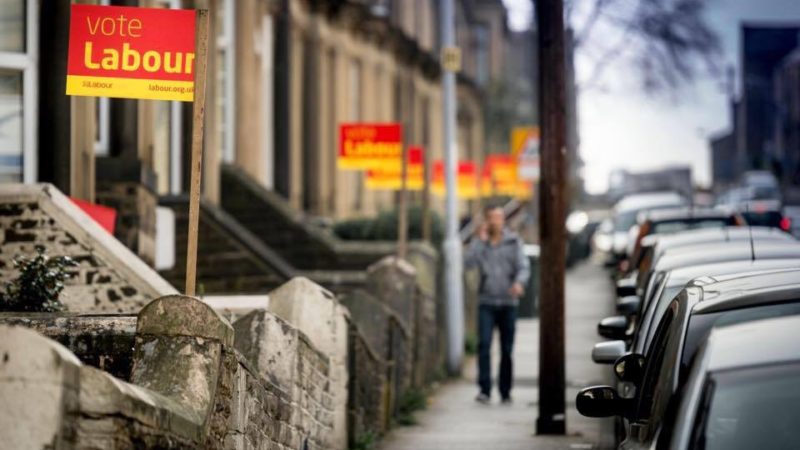
I’ve been reviewing Labour’s performance in local council by-elections on a regular basis for LabourList. With the main local election campaign starting, and possibly European elections and a general election on the horizon, what has happened on this front in the three months since the New Year?
Here, in the same format as I have presented them previously, is the change in Labour vote share in all the council by-elections where there has been a Labour candidate in the last two contests (to allow a comparison to be drawn). The results are grouped by region so you can see the pattern around the country.
There have been very few by-elections in this quarter because the six-month rule applies to all the councils with elections on 2nd May – i.e. there are no by-elections in a council if vacancies occur in the final six months before the scheduled elections for that council.
Therefore, while usually I would analyse the regional patterns, this isn’t possible this time as there are so many regions where there have been only one or two contests. To the extent that there are any comparable figures, every region except the South East looks worse than it did in the May to December 2018 period, which itself was a worse set of results than those of the first quarter of 2018.
Of a total of 24 by-elections during this period, Labour’s vote share was up in only eight, exactly one third of them, down from 49% of the contests in May to December 2018 and 74% in the first quarter of 2018. This is therefore the worst period for Labour since the 2017 general election, but still slightly better than the pre-general election results.
On the basis of these local results, the party would be advised to manage expectations about the 2nd May council elections carefully, and to be cautious about the desirability of an early general election.
Eastern – average change in Labour vote -4.4%
Aveley & Uplands (Thurrock)
Milton (Southend)
Vange (Basildon)
East Midlands
Oundle (Northamptonshire)
London – average change in Labour vote -6.7%
Dalgarno (Kensington & Chelsea)
Lansbury (Tower Hamlets)
Norbury & Pollards Hill (Croydon)
Shadwell (Tower Hamlets)
Thornton (Lambeth)
Wallington North (Sutton)
North – average change in Labour vote -9.9%
Esh and Witton Gilbert (Durham)
Wingate (Durham)
North West – no by-elections
Scotland
Clackmannanshire Central (Clackmannanshire) -8.0%
South East – average change in Labour vote +0.1 per cent
Bexhill West (East Sussex)
Coxford (Southampton)
Everdons (Wokingham)
St Marks (Rother)
Totteridge & Bowerdean (Buckinghamshire)
Warlingham (Surrey)
South West
Berkeley Vale (Stroud)
Wales – average change in Labour vote -2.7%
Ely (Cardiff)
Rhoose (Vale of Glamorgan)
West Midlands
Holditch & Chesterton (Newcastle under Lyme) -13.9%
Yorkshire & Humberside
Bolton & Undercliffe (Bradford)


More from LabourList
Which ministers have done the most and fewest broadcast rounds in year one?
‘Welfare reforms still mean a climate of fear. Changes are too little, too late’
Welfare bill: Which MPs are still voting against reforms?