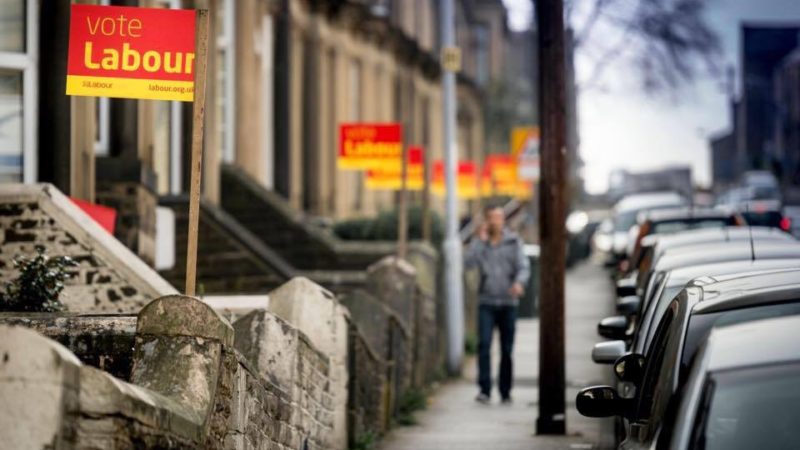
I’ve been reviewing Labour’s performance in local council by-elections on a regular basis for LabourList. With the general election campaign underway, what has happened on this front since the European elections in May?
Here, in the same format as I have presented them previously, is the change in Labour vote share in all the council by-elections where there has been a Labour candidate in the last two contests (to allow a comparison to be drawn). The results are grouped by region, in order to show the pattern around the country.
Labour’s average vote share in these by-elections was down since the seats were previously contested in every region except the North, where it is marginally up. Most regions saw a similar pattern of a drop in Labour vote share of between 5% and 8%, but there were significantly worse performances of -10.8% in London, the most anti-Brexit region, -14.1% in the South West, where the recent revival of the Lib Dems has led to a tactical voting squeeze on Labour in rural areas of historic Lib Dem strength, and in two regions where there is strong support for Brexit: the West Midlands (-13.2%) and Yorkshire and Humberside (-22.3%).
Whilst the impact in a general election of a sharp Labour decline in the South West is minimal, as the region has very few Labour seats or target seats, both the West Midlands and Yorkshire are full of the parliamentary marginals that will determine the final outcome on December 12th.
The sudden worsening of Labour’s position since the spring is starkly shown by the fact that of a total of 65 by-elections during this period, Labour’s vote share was up in only six, 9% of the total, down from 33% in the first quarter of 2019, 49% of the contests in May to December 2018 and 74% in the first quarter of 2018.
This is the worst period for council by-election results for Labour since Jeremy Corbyn became leader, so he will need to pull off a similar mid-campaign turnaround to 2017 to get a good result in the general election.
Eastern
↳ average change in Labour vote -8.5%
Alexandra (Ipswich) -3.7%
Clacton East (Essex) -6.1%
Clarence (St Albans) -6.4%
Icknield (Luton) -5.6%
Marconi (Chelmsford) -12.3%
Newnham (Cambridge) -18.1%
Tudor (Watford) -7.6%
East Midlands
↳ average change in Labour vote -6.6%
Abbey North (Daventry) -11.3%
Beanfield (Corby) -5.1%
Billinghay, Martin and North Kyme (North Kesteven) -10.5%
Brixworth (Daventry) -10.6%
Finedon (Wellingborough) -12.1%
Irthlingborough Waterloo (East Northamptonshire) +11.6%
Middleton Cheney (South Northamptonshire) -14.1%
Sandhurst (Mansfield) -8.3%
Stapleford South East (Broxtowe) -2.9%
Syston West (Charnwood) -13%
London average change in Labour vote -10.8%
Cannon Hill (Merton) -13.9%
East Sheen (Richmond upon Thames) -3.8%
Fairfield (Croydon) -10.2%
Fulham Broadway (Hammersmith & Fulham) -11.6%
Furzedown (Wandsworth) -14.7%
North
↳ average change in Labour vote +1.9%
Hart (Hartlepool) +1.3%
Park End & Beckfield (Middlesbrough) +6.3%
Penrith South (Eden) -1.9%
North West
↳ average change in Labour vote -6.9%
Eccleston & Mawdesley (Chorley) -3.0%
Farington West (South Ribble) -7.8%
Hazel Grove (Stockport) -3.2%
Old Swan (Liverpool) -17%
Princes Park (Liverpool) +5.5%
Radcliffe West (Bury) -24.7%
Walkden South (Salford) +1.6%
Scotland
↳ average change in Labour vote -7.5%
Bridge of Don (Aberdeen) -5.2%
East Kilbride Central North (South Lanarkshire) -11.3%
Thorniewood (North Lanarkshire) -5.9%
South East
↳ average change in Labour vote -5.4%
Brockhurst (Gosport) -4.7%
Chestfield (Canterbury) -6.8%
Downs North (Ashford) -7.6%
Riverside (Windsor & Maidenhead) -4%
St Mark’s (Rushmoor) -6.1%
Three Bridges (West Sussex) -10.5%
Tilgate (Crawley) -7.3%
Westcourt (Gravesham) -5.5%
Whippingham and Osborne (Isle of Wight) +3.5%
South West
↳ average change in Labour vote -14.1%
Barnwood (Gloucester) -6.9%
Heavitree & Whipton Barton (Devon) -19.4%
Norton Fitzwarren & Staplegrove (Somerset West & Taunton) -5.1%
Podsmead (Gloucester) -33.9%
Trowbridge Drynham (Wiltshire) -16.3%
Vivary (Somerset West & Taunton) -9.9%
Westbury North (Wiltshire) -6.9%
Wales
↳ average change in Labour vote -7.4%
Cyncoed (Cardiff) -3.3%
Llanbadarn Fawr Sulien (Ceredigion) -3.6%
Llandrindod North (Powys) -1.2%
Pelenna (Neath Port Talbot) -11%
Rhondda (Rhondda Cynon Taf) -15.1%
Whitchurch & Tongwynlais (Cardiff) -10%
West Midlands
↳ average change in Labour vote -13.2%
Bromsgrove South (Worcestershire) -32.2%
Claines (Worcester) -12.4%
Leamington Lillington (Warwick) -5.5%
Meole (Shropshire) -2.9%
Rokeby & Overslade (Rugby) -8.8%
Wainbody (Coventry) -16.4%
Yorkshire and Humberside
↳ average change in Labour vote -22.3%
Bridlington North (East Riding of Yorkshire) -24.5%
St Andrew’s & Docklands (Kingston upon Hull) -20.1%


More from LabourList
Letters to the Editor – week ending 8th February 2026
Morgan McSweeney resigns as Starmer’s chief of staff over Mandelson scandal
‘Branching out: how Labour lost its local roots’