
People who join political parties are abnormal. Even if we take into account the phenomenal growth of Labour’s grassroots support since 2015, fewer than five per cent of British adults are party members.
That doesn’t mean, of course, that people who join political parties are weird. Despite a stereotype that sees them as either ideological zealots or crazed careerists, most of them are simply folk who are interested in politics and enjoy mixing with people who, like them, believe in their chosen party’s values and would much rather see them govern than the other lot.
True, there are big differences in how the members of different parties view the same issue – whether we’re talking about austerity, immigration, law and order, or Brexit. But we need to be careful that those political differences don’t blind us to the fact that, demographically-speaking, the members of different parties may have more in common than they might care to admit.
The ESRC-funded Party Members Project that I work on with Paul Webb, from Sussex University, and Monica Poletti who, like me, is based at Queen Mary University of London, has enabled us, with the help of YouGov, to survey samples of party members immediately after both the 2015 and 2017 general elections. As a result we hope we have a pretty good idea of what Labour members, in the aggregate, look like and how they compare to members of other parties.
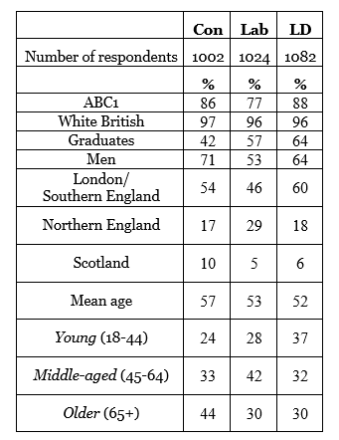
Our research suggests that, like it or not, Labour’s membership is not much less middle-class and less white than the memberships of its two main rivals. Three-quarters of Labour members fall into the ABC1 category, and while this is by no means an ideal measure of class – objective or subjective – it doesn’t throw up a huge difference with the Tories and the Lib Dems, nearly nine out of ten of whose members fall into the same category. As for ethnicity, white British members make up over 95 per cent of the total in each and every one of the three parties.

That said, Labour does stand out from its counterparts when it comes to gender. Partly because of those who have joined it since 2015, the party has far more female members as a proportion of its total membership than do the Conservatives and the Lib Dems. Indeed, Labour is getting close, probably for the first time in its history, to gender parity among its members.
When it comes to where Labour members live, there is an interesting – but, given the importance, of London, by no means total – mismatch between the party’s electoral heartlands, which are in the north, and where nearly half of its grassroots supporters are located, in London and the south.
And finally, age – the thing that seems to excite so much interest, not least because it was such a big deal when it came to voting in this year’s general election. In June, the Conservatives did badly among “young” voters, those aged between 18 and 44, and where Labour performed poorly among more “middle-aged” and “older” voters.
Labour’s membership, however, doesn’t exactly mirror that split. Although the post-2015 narrative has been all about a flood of younger people into the party, the reality appears to be a little different. Sure, some young people have joined, but so too have many middle-aged people, many of them folk who left the party in the Blair era but who have now re-joined under Jeremy Corbyn.
But while the Labour membership’s age profile (28 per cent 18-44, 42 per cent 45-64 and 30 per cent 65+) might not meet the expectations of those members who would prefer it to project purely youthful idealism and energy and look “better” than that of the Lib Dems, it is at least healthier (no pun intended) than that of the Conservatives, getting on for half of whose members are at or nearing retirement age.
Now, there are bound to be caveats and criticisms of all this, arguing, for example, that way more Labour members live in London or are younger than our research suggests. And they might have a point. Even though YouGov’s work on Labour leadership elections suggests it has a pretty good handle on the party’s membership, the surveys it conducted for us will never be perfect and, given how much churn there is in parties’ memberships, it can only ever be a snapshot of a moving target.
Moreover, we would love to be able to compare and weight our data to the data on members held by the parties themselves, presuming of course that they hold it accurately and comprehensively, which in the Conservatives’ case is open to serious doubt. But, thus far, they have all proved rather reluctant to make it publicly available.
Any readers who feel we’ve got it wrong are most welcome to visit our website and email us – and, if they’re members, who knows, they might feel like putting forward resolutions at conference encouraging their parties to publish the figures themselves!


More from LabourList
Nudification apps facilitate digital sexual assault – and they should be banned
Diane Abbott suspended from Labour after defending racism comments
Labour campaign groups join forces to call for reinstatement of MPs