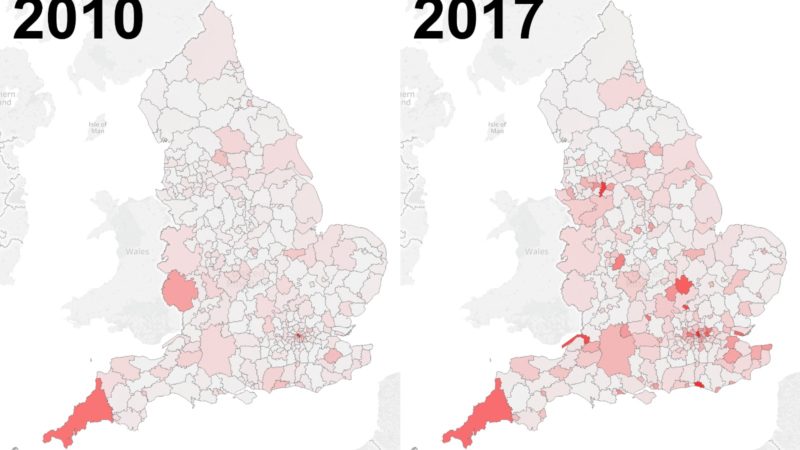
Following the release of Shelter’s report on homelessness last week, I’ve developed a tool to visualise publicly available data on rough sleeping in England between 2010 and 2017. The data, provided by the Ministry of Housing, Communities and Local Government, shows a dramatic increase in rough sleeping across the country over the last seven years.
Mapped across information from the Office for National Statistics and OpenStreetMap, the visualisations allow you to search and view locally-collected figures and give a clear indication of where local authorities are now unable to meet their citizens’ housing needs.
Take London, for example, where rough sleeping has increased by 188% from 2010, when 319 rough sleepers were recorded, to 2017, when 1,129 rough sleepers were recorded. According to the data, Conservative-run Westminster has consistently recorded the highest levels of rough sleeping in the country over the past eight years. 217 people were seen sleeping rough in 2017, one sadly passing away earlier this year at the foot of parliament.
Outside of London, Brighton and Hove has seen an increase of almost 12 times its 2010 figure, from the 14 people recorded as the last Labour government left power to 178 people facing the consequences of Tory austerity. With very few exceptions, this is the case across England: there has been a vast and undeniable increase in rough sleeping numbers since the Conservative Party came to power.
The tool used to create the visualisations, Tableau, is freely-available software that allows you to segment data to present in a number of striking ways. The vast majority of high rough sleeping figures seem to be concentrated in and around cities, but a particularly interesting result of mapping the data shows other ways in which geography can affect poverty. In Cornwall, for example, its seaside location and tourist destination status have driven house prices far in excess of wage growth, leading to high levels of rough sleeping and the launch of a £1.1m campaign by the local council to prevent it.
Those kinds of measures cost money, of course. As The Observer recently reported, central government grants to local authorities have been cut by 49% since 2010. Having stood as a council candidate in Camden in May, it’s clear how much of an effect a lack of financial support has on a council’s ability to support citizens. The figures, showing a tenfold increase in rough sleepers in Camden since 2010, prove this to be the case.
Now that Universal Credit is rolling out, rough sleeping numbers are almost certainly going to rise. Dan Corry, a former policy chief for Gordon Brown, wrote in The New Statesman that “tenants claiming Universal Credit are more than twice as likely to be in rent arrears than those on the old system”. That’s why Labour’s focus on Universal Credit is so crucial, and why local groups across the country have been mobilising to oppose it. Camden Labour, for example, have launched a social media campaign seen by over 80,000 people, held protests outside local Jobcentres and collected over 700 signatures for a petition, supported by Keir Starmer, calling for the Universal Credit rollout to be stopped.
While the Tories continue to deny the effects of their callous policies and claim austerity to be over, this data shows that ever-deepening cuts to local government have a real, tangible effect on peoples’ lives.
Use the tool to search for your local authority and see how austerity has affected your area.
James Calmus is a Labour activist.

More from LabourList
Time to care
‘Could delivery of the Cancer Plan become the proof point of the Burnham government?’
‘We cannot go backwards on health and safety’