I’ve been reviewing Labour’s performance in local council by-elections on a regular basis for LabourList.
So what has happened on this front in the period between the general election and the new year?
Here, in the same format as I presented them previously, is the change in Labour vote share in all the council by-elections where there has been a Labour candidate in the last two contests (so a comparison can be drawn). The results are grouped by region so you can see the pattern around the country.
The good news for Labour is that the big increase in the vote in the general election is being followed through across the country – albeit in most regions at about half the 9.5 per cent increase seen in June – in line with the stable national opinion poll rating of about 40 per cent.
Compared to previous reviews there is far less geographical variation, with an increased Labour vote share in every single region and nation.
In seven regions the change in Labour’s vote is remarkably even, at between 4.2 and 5.1 per cent.
The outliers with even better performances are:
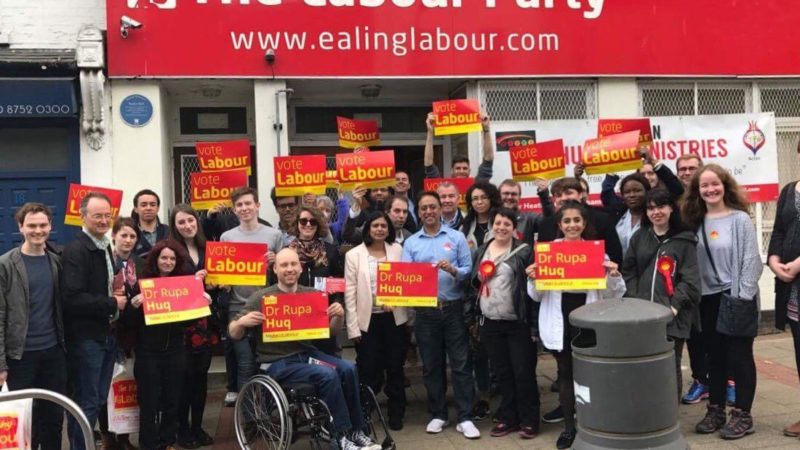
- London, with an 11 per cent increase in Labour vote share, which is double that in most regions. This reflects impressive Labour performances there in the last three general elections and the last two rounds of borough elections, as the city becomes more and more left-wing due to demographic change and cultural divergence from the rest of Britain. This bodes extremely well for Labour in May when every London council seat is up for election, and a number of Tory boroughs could fall to Labour control. This is the only region other than Scotland where the council by-election performance is better than the general election performance.
- South west, a 9.1 per cent increase. Reflecting the surprise breakthrough in vote share in the general election in what had been Labour’s weakest region, and the very large increases in party membership there.
- North west, a 7.0 per cent increase. This reflects Labour’s strong performance in the region, and particularly Merseyside and Greater Manchester, in the general election.
- East midlands, a 6.2 per cent increase. This is surprising as this was a region where Labour under-performed in the general election, losing two seats in former mining areas where there was strong support for Brexit.
Within the south east, there seems to be a particular Labour revival on the Kent and Sussex coasts, with five by-elections there showing extraordinary vote increases of over 20 per cent. Some of this may be driven by demographic change as people move out of London to the coast due to rising property prices.
Of a total of 124 by-elections during this period, Labour’s vote share was up in 87 of the contests, 70 per cent, whereas before the general election the pattern was the exact reverse of this.
Eastern – average change in Labour vote +4.9 per cent
Borehamwood Kenilworth (Hertsmere) -9.1 per cent
Chorleywood South and Maple Cross (Three Rivers) +0.1 per cent
Ely South (East Cambridgeshire) +6.5 per cent
Eye, Thorney & Newborough (Peterborough) +15.2 per cent
Handside (Welwyn Hatfield) -3.5 per cent
Kirkley (Waveney) +12.2 per cent
Oulton Broad (Waveney) +5.4 per cent
Oxhey Hall & Harling (Three Rivers) +4.4 per cent
Park (Peterborough) -0.7 per cent
Scotter and Blyton (West Lindsey) -1.3 per cent
Shrub End (Colchester) +20.5 per cent
Soham North (East Cambridgeshire) -0.4 per cent
St John’s (Suffolk) +5.3 per cent
St Margaret’s (Waveney) -1.3 per cent
St Margarets with St Nicholas (King’s Lynn) -3.1 per cent
St Mary’s (Forest Heath) +8.8 per cent
Sudbury South (Babergh) +16.3 per cent
Toddbrook (Harlow) +13.6 per cent
East midlands – average change in Labour vote +6.2 per cent
Ashbourne South (Derbyshire Dales) -1.9 per cent
Basford (Nottingham) +21.4 per cent
Bestwood (Nottingham) +9.5 per cent
Bulwell Forest (Nottingham) +8.2 per cent
Burbage Sketchley & Stretton (Hinckley & Bosworth) +2 per cent
Carholme (Lincoln) +6.3 per cent
Eastfield (Northampton) +13.5 per cent
Eyres Monsell (Leicester) +10.6 per cent
Holmebrook (Chesterfield) -8.5 per cent
Hucknall North (Ashfield) -6.5 per cent
Limestone Peak (High Peak) +0.6 per cent
Loughborough Hastings (Charnwood) +17.7 per cent
Nene Valley (Northampton) +7.8 per cent
Oadby Uplands (Oadby and Wigston) +2.2 per cent
Shelthorpe (Charnwood) +5.8 per cent
Sudbrooke (West Lindsey) +10.5 per cent
London – average change in Labour vote +11 per cent
Enfield Highway (Enfield) +23.1 per cent
Gospel Oak (Camden) +10.5 per cent
South Norwood (Croydon) +7.9 per cent
St Helier (Merton) +3.1 per cent
Thamesfield (Wandsworth) +10.0 per cent
William Morris (Waltham Forest) +11.5 per cent
North – average change in Labour vote +4.2 per cent
Ayresome (Middlesbrough) +17.6 per cent
Billingham North (Stockton) +5.3 per cent
Dowdon (Durham) +6.2 per cent
Egremont South (Copeland) +15.7 per cent
Mowden (Darlington) -10.4 per cent
Park End and Beckfield (Middlesbrough) +11.9 per cent
Parkfield and Oxbridge (Stockton-on-Tees) +2.2 per cent
Penrith North (Eden) -8.5 per cent
Red Hall & Lingfield (Darlington) -1.9 per cent
Seaton (Hartlepool) -4.9 per cent
St Germain’s (Redcar) +2.8 per cent
Trimdon & Thornley (Durham) +15.2 per cent
Victoria (Hartlepool) +10.7 per cent
Yarm (Stockton-on-Tees) -3.2 per cent
North west – average change in Labour vote +7 per cent
Astley Mosley Common (Wigan) -5.3 per cent
Bucklow-St Martins (Trafford) +1.8 per cent
Chapelford and Old Hall (Warrington) +9.8 per cent
Claremont (Salford) +1.4 per cent
Crewe East (Cheshire East) +14.8 per cent
Derby (West Lancashire) +0.6 per cent
Droylsden East (Tameside) +8.9 per cent
Dukes (Sefton) -2.3 per cent
Fallowfield (Manchester) +15.3 per cent
Halton-with-Aughton (Lancaster) +18 per cent
Langworthy (Salford) +8.9 per cent
Rossall (Wyre) +16.4 per cent
Shevington with Lower Ground (Wigan) +3.4 per cent
Skerton West (Lancaster) +24.5 per cent
Staining & Weeton (Fylde) -15.1 per cent
St Michaels (Knowsley) +12.2 per cent
Scotland – average change in Labour vote +4.4 per cent
Cardonald (Glasgow) +10.1 per cent
Elgin City North (Moray) +3.8 per cent
Fortissat (North Lanarkshire) +2 per cent
Inverurie (Aberdeenshire) +3.7 per cent
Perth City South (Perth & Kinross) -0.7 per cent
Rutherglen Central & South (South Lanarkshire) +7.5 per cent
South east – average change in Labour vote +5.1 per cent
Bridgemary North (Gosport) -49 per cent
Burnham Lent Rise & Taplow (South Bucks) -0.4 per cent
Chiddingly & East Hoathly (Wealden) +9.4 per cent
Didcot South (South Oxfordshire) +12.1 per cent
Didcot West (South Oxfordshire) +12.6 per cent
East Grinstead Imberhorne (Mid Sussex) -8.7 per cent
Godalming Central & Ockford (Waverley) -4.6 per cent
Hedge End Grange Park (Eastleigh) +0.9 per cent
Margate Central (Thanet) +23.7 per cent
Marine (Worthing) +27.8 per cent
Mash Barn (Adur) +29.7 per cent
Meopham North (Gravesham) -7 per cent
Milton Regis (Swale) +25.1 per cent
New Romney (Shepway) +21.5 per cent
North (Maidstone) +8 per cent
Ouse Valley & Ringmer (Lewes) -4.4 per cent
Riverside (Aylesbury Vale) +6.5 per cent
Southcourt (Aylesbury Vale) -0.5 per cent
St Margaret’s-at-Cliffe (Dover) +7.6 per cent
Stubbington (Fareham) -0.5 per cent
Westway (Tandridge) -2.8 per cent
South west – average change in Labour vote +9.1 per cent
Blandford Central (North Dorset) +25.1 per cent
Chalford (Stroud) -6.1 per cent
Newtown and St Leonards (Exeter) +1.2 per cent
North Worle (North Somerset) +21.7 per cent
Watcombe (Torbay) -8.4 per cent
Westexe (Mid Devon) +11.5 per cent
Winterbourne (South Gloucestershire) +18.6 per cent
Wales – average change in Labour vote +4.7 per cent
Bryn-Coch South (Neath Port Talbot) +4.5 per cent
Buckley Bistre West (Flintshire) +4.8 per cent
West Midlands – average change in Labour vote +4.8 per cent
Bolehall (Tamworth) +14.6 per cent
Bradwell (Newcastle-Under-Lyme) -3.1 per cent
Hednesford & Rawnsley (Staffordshire) +4.2 per cent
Hednesford Green Heath (Cannock Chase) +11.1 per cent
Hednesford South (Cannock Chase) -13.2 per cent
Leek East (Staffordshire Moorlands) +25.6 per cent
Newchapel (Newcastle-Under-Lyme) -10.9 per cent
Stoneleigh & Cubbington (Warwick) +15.1 per cent
Stretton (East Staffordshire) -0.4 per cent
Yorkshire & Humberside – average change in Labour vote +4.8 per cent
Batley East (Kirklees) +14.1 per cent
Beighton (Sheffield) +5.2 per cent
Kingstone (Barnsley) -2.4 per cent
Mulgrave (Scarborough) +20.8 per cent
Nether Edge & Sharrow (Sheffield) +6.8 per cent
Rockingham (Barnsley) -9.8 per cent
Stanley & Outwood East (Wakefield) +2.4 per cent
Wakefield West (Wakefield) +7.1 per cent
Washburn (Harrogate) -0.9 per cent

More from LabourList
Round up of Burnham’s ministerial appointments
New PM Burnham begins with boldness and ambition for Britain
What do Labour’s MPs and factions want to see from Burnham’s government?