In the run-up to every set of May elections when there isn’t a simultaneous general election, I write a preview of the local elections, including historical data so we can benchmark Labour’s performance. I’ve been doing this since 2011.
This year is the smallest set of local elections in the four-year cycle, and definitely the last before the general election. Around 2,592 councillors are being elected across 107 councils. This compares to 8,500 councillors elected in 2023.
It’s unusual in that the councillors up for re-election have only served a three-year term, as Covid delayed the scheduled 2020 elections by a year and they were held on the same day as another set in May 2021. This also makes analysing performance in 2021 difficult, as it was a tangled mess of two sets of elections held at the same time, and you can’t easily disaggregate the data from the two.
The councils up for election are:
- Every seat (191 councillors) in 3 Metropolitan Boroughs (Dudley, North Tyneside and Rotherham)
- One third of the seats (615 councillors) in 28 Metropolitan Boroughs
- Every seat (264 councillors) in 4 Unitary Councils (Bristol, Dorset, Warrington and Wokingham)
- One third of the seats (219 councillors) in 14 Unitary Councils
- Every seat (753 councillors) in 18 District Councils
- Half the seats (69 councillors) in 4 District Councils
- One third of the seats (481 councillors) in 36 District Councils
Also up for election are:
- The Mayor of London
- All 25 seats in the London Assembly
- Nine Combined Authority Mayors (East Midlands, Greater Manchester, Liverpool City Region, North East, South Yorkshire, Tees Valley, West Midlands, West Yorkshire, York & North Yorkshire)
- The Mayor of Salford
- All 35 Police and Crime Commissioners in England
- All four Police and Crime Commissioners in Wales
When most of these elections were last fought in May 2021, Labour was only just beginning its recovery from the years of Jeremy Corbyn’s leadership and consequently these were a strong set of results for the Tories. They gained a net 235 councillors and a net 13 councils whilst Labour lost a net 327 councillors and lost control of a net 8 councils. The projected national vote share calculated by the BBC was 36% Conservative, 29% Labour, 17% Lib Dem.
However, it is important to note Lewis Baston’s calculation that a third of this year’s council contests were last fought in other years (2019, 2022 or 2023) and have come up again “out of cycle”, usually due to boundary changes. These were already bad years for the Tories so there are very few wards in these batches that are still Tory-held and vulnerable to being lost.
Also note that the headline figures for Tory gains and Labour losses in 2021 are larger than normal, as this was a double set of elections including both the polls normally scheduled for 2021, and the ones scheduled for 2020 but delayed because of Covid. The “proper” 2021 seats, as opposed to the delayed 2020 ones, will not be fought again until 2025 so Labour can’t yet win back everything it lost in 2021, as much of it won’t be fought until next year.
Which councils are Labour hoping to gain in May?
Labour will be looking to make gains in councils such as Harlow and Thurrock in Essex; Bolton and Burnley in the North West; Cannock Chase, Dudley, Redditch, Tamworth and Worcester in the West Midlands; and Hastings, Milton Keynes and Rushmoor in the South East, the latter having already been the scene of significant gains in a traditionally Tory part of Hampshire last year.
Oxford needs to be re-gained after overall control being lost through Labour councillors defecting to independent over Gaza. Oldham is a defensive battleground for Labour with similarly volatile politics to next-door Rochdale.
Rotherham is another defensive challenge for Labour as it only needs to lose five seats to lose control, and every seat there is up for election this year. Bristol and Sheffield are already No Overall Control but Labour will need to prevent further advances by opponents including the Greens.
Measuring Labour’s local election performance
There are at least four ways of measuring Labour’s national performance: national projected vote share (which the BBC calculates for the whole country, including areas not voting this year), raw number of councillors, number of councillors gained or lost and number of councils controlled.
Looking first at projected national vote share, the estimated figures the BBC uses are as follows:
- 2010: 29% (general election result)
- 2011: 37%
- 2012: 38%
- 2013: 29%
- 2014: 31%
- 2015: 30% (general election result)
- 2016: 31%
- 2017: 27%
- 2018: 35%
- 2019: 28%
- 2020: No election due to Covid
- 2021: 29%
- 2022: 35%
- 2023: 35%
National vote share in local elections for Labour is always lower than the Westminster opinion polls, because the Greens, Lib Dems and Independents perform better in local than in general elections, when they get squeezed.
Raw number of councillors is the national (Great Britain) total figure, including all the thousands of councillors not up for election (by-elections and changes of party make it difficult to track the exact figure):
- 2010: 4,831
- 2011: 5,691
- 2012: 6,559
- 2013: 6,850
- 2014: 7,098
- 2015: 6,895
- 2016: 6,859
- 2017: 6,297
- 2018: 6,468
- 2019: 6,323
- 2021: 5,656
- 2022: 5,904
- 2023: 6,415
Number of gains or losses. For comparison, here are the years since Margaret Thatcher came to power in which Labour has made net gains (in the other 18 years not listed, we lost seats):
- 1980: +601 Labour councillors
- 1981: +988
- 1983: +8
- 1984: +88
- 1986: +13
- 1988: +76
- 1989: +35
- 1990: +284
- 1991: +584
- 1993: +111
- 1994: +44
- 1995: +1,204
- 1996: +468
- 2010: +372
- 2011: +860
- 2012: +847
- 2013: +288
- 2014: +256
- 2018: +79
- 2022: +108
- 2023 +536
The sets of local elections not coinciding with a general election in which Labour lost seats while in opposition have been 1982 (the year of the Falklands war), 1985 (the year of the miners’ strike), 2016, 2017, 2019 and 2021. It is unlikely that Labour can match its 2023 gains figure as so few seats are being elected compared to last year.
Control of councils. The number of councils that Labour has controlled has been as follows:
- 2002 – 136
- 2003 – 103
- 2004 – 94
- 2005 – 92
- 2006 – 75
- 2007 – 58
- 2008 – 46
- 2009 – 37
- 2010 – 54
- 2011 – 81
- 2012 – 114
- 2013 – 117
- 2014 – 120
- 2015 – 114
- 2016 – 114
- 2017 – 107
- 2018 – 105
- 2019 – 99
- 2021 – 91
- 2022 – 96
- 2023 – 116
Five net gains would take Labour to its highest number of councils controlled since 2002.
The key mayoral races for Labour
Because they are such high-profile roles, there will inevitably be a big media focus on the nine Combined Authority Mayors. Three of these contests are key battles both because they are difficult for Labour to win and because they contain large numbers of parliamentary battleground seats within their boundaries.
East Midlands is a totally new Mayoral position. West Midlands is held by Tory incumbent Andy Street, who won by 54% to 46% for Labour’s Liam Byrne after transfers in 2021, having first been elected in 2017, and presents himself as a quasi-independent figure, critical of his own government.
Tees Valley Tory Mayor Ben Houchen has also distanced himself from his unpopular national party and defends a whopping 72.8% first preference win from 2021, having first been elected more narrowly in 2017. The swing required in Tees Valley is far above what we are currently getting in national opinion polls. Whilst a gain there seems unlikely, Labour still has to campaign hard there because it contains a number of parliamentary battleground seats.
The Mayoral challenge is made more difficult for Labour by the government switching the voting system for these ballots to First Past the Post. It’s important to note that because they are personality-based they can be counter-cyclical and produce results that go in the opposite direction to council and parliamentary elections in the same areas.
Looking at London
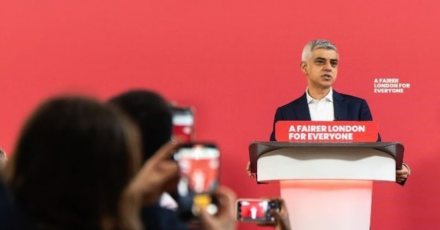
Polling for London Mayor seems to show Sadiq Khan set for victory against a hardline right-wing Tory challenger but needs to persuade Greens and Lib Dems who previously transferred to him with their second preference votes to vote tactically for him now the ballot is First Past the Post.
The London Assembly election results are seldom dramatic as the mixed constituency and top-up list voting system often sees constituency gains and losses offset by compensatory changes in the list results.
West Central is the top target assembly constituency for Labour, with a Tory majority of only 2,225; followed by South West, with a Tory majority of 12,267. Labour is defending 11 of the 25 London Assembly seats (9 constituency ones and 2 list ones), the highest number it has ever won is 12.
Labour’s most winnable PCC races
The elections for Police and Crime Commissioners (PCCs) have never caught the public imagination or generated a high turnout, and often feature independent candidates with a professional law and order background. They do however ensure that on 2nd May there will be an election in every part of England and Wales, including those areas without council or Mayoral polls.
Labour performed badly in the 2021 PCC polls, losing six of the 14 PCCs it held before the election. Since then, the South Yorkshire and North Yorkshire PCC roles have been abolished, so Labour is defending just seven of the now 37 PCCs.
The most winnable targets for Labour, based on the margin of victory in 2021 on the second count after transfers, are:
- Lancashire: 2.54 percentage point Tory lead over Labour
- Nottinghamshire: 2.72pp
- Avon & Somerset: 4.88pp
- Humberside: 5.24pp
- Cambridgeshire: 5.48pp
- Cheshire: 5.92pp
- Bedfordshire: 8.12pp
- Derbyshire: 12.04pp
- Leicestershire: 14.02pp
- Thames Valley: 14.58pp
As usual, it will be important to “look under the bonnet” of these elections and see if Labour is making council, Mayoral and PCC gains where it matters, in the areas that coincide with battleground parliamentary seats needed to form a Labour government.
If you have anything to share that we should be publishing about this or any other topic involving Labour, on record or strictly anonymously, contact us at [email protected].
Sign up to LabourList’s morning email for a briefing everything Labour, every weekday morning.
If you can help sustain our work too through a monthly donation, become one of our supporters here.
And if you or your organisation might be interested in partnering with us on sponsored events or content, email [email protected].

More from LabourList
Football’s greatest lesson for politics isn’t about winning
‘Debate and disagreement and are nothing to be feared’
Who can rebuild Scottish Labour?